Custom Field Report
Custom field reports will help you to keep a track of custom fields where custom fields can be analyzed for multiple projects or task lists in one report.
- The X-axis will reflect the custom fields “Multiselect” and “Dropdown” and also it will show Project, Task workflow stage, and Priority.
- The Y-axis will reflect the custom fields “Currency”, “Numbers”, and “Percentage” and also you can see the task count.
- Custom Fields reports can be created to analyze comparisons and relations between different custom fields.
Note: The name of the custom fields should be the same in all the projects or task lists to get accurate results.
Following are the steps to create a custom field report:
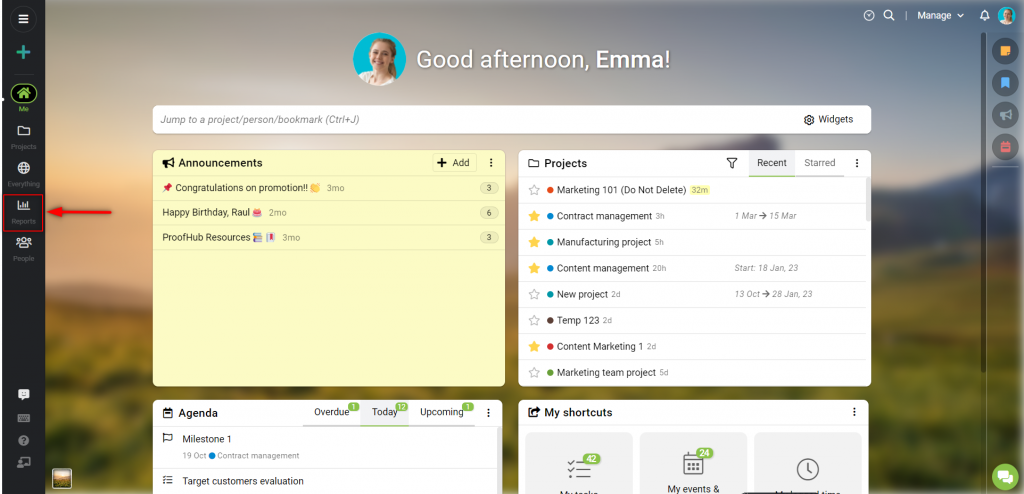
- Select “Reports” from the left navigation bar.
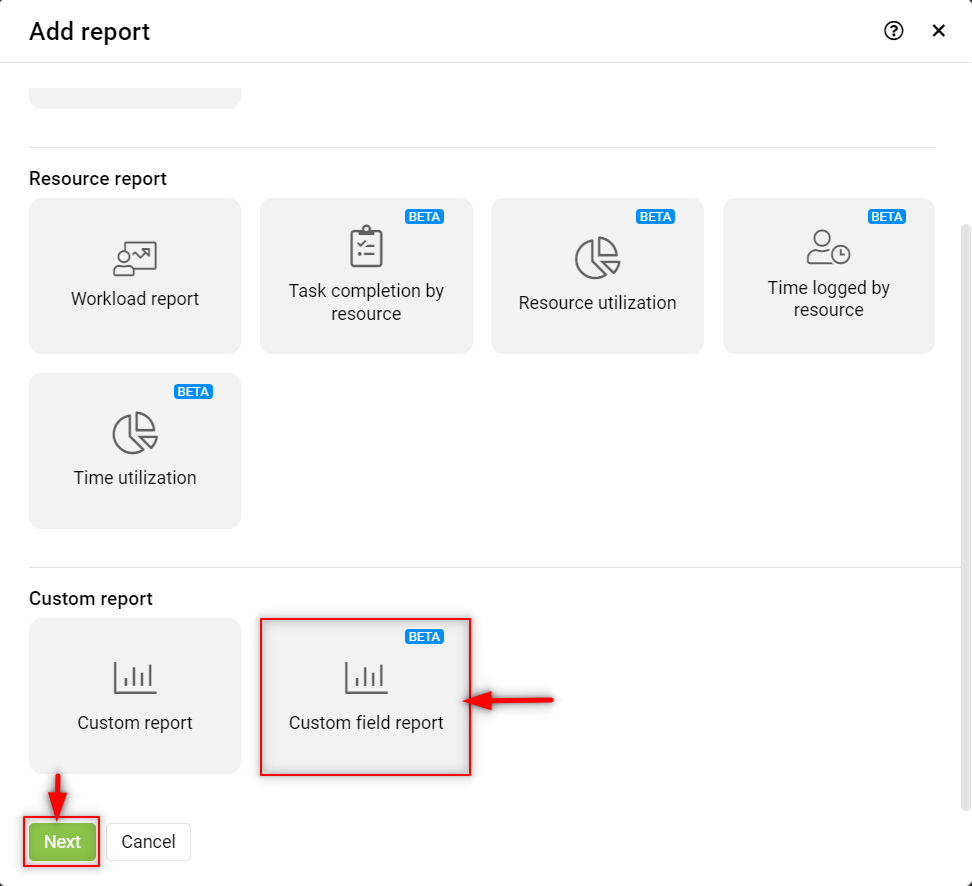
- Click on “Add” & select the custom field report. Then select “Next”.
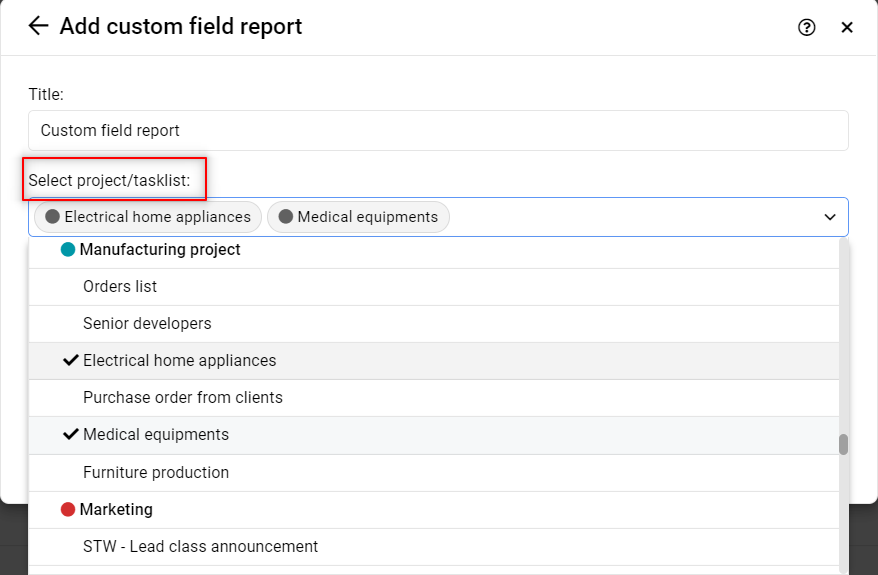
- Add “Title” and select “Projects/Tasklists” for which you would like to create a custom field report.
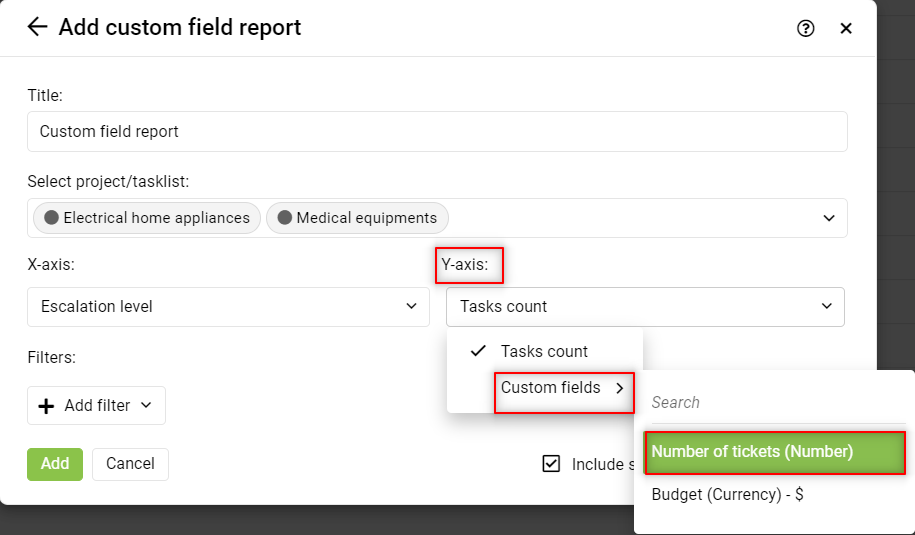
- Create a report to analyze the custom field and task count relation. On X-axis, the dropdown or muti-select custom fields.
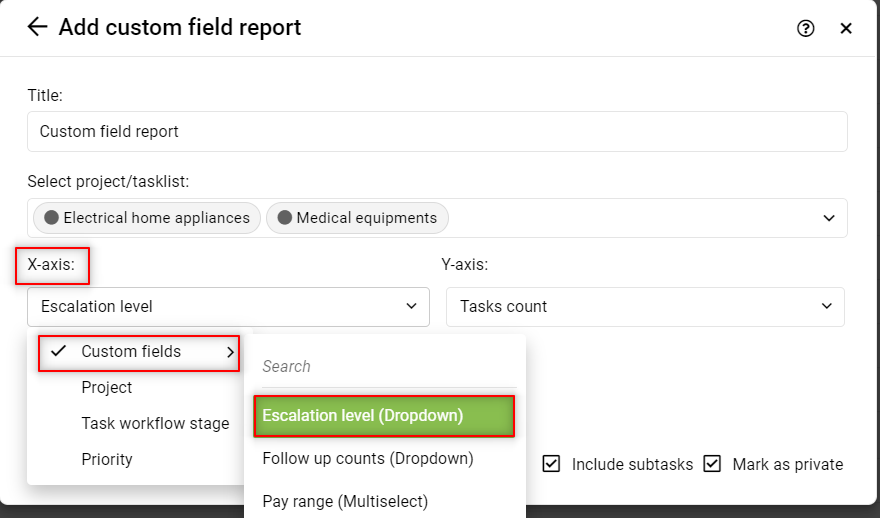
- On Y-axis, select task count or custom fields currency, percentage, or numbers.
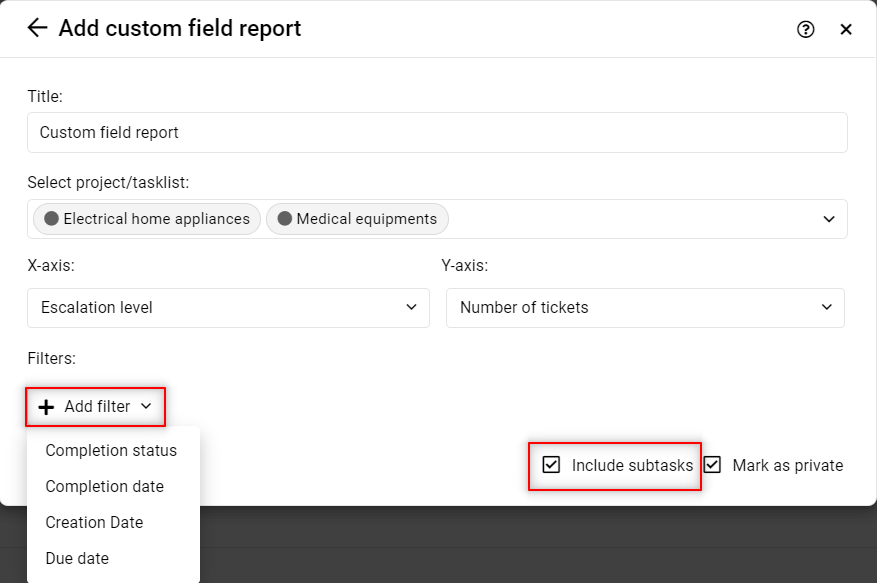
- Enable the “Include subtasks” option to see all the details.
- Also, other filters such as “Completion status”, “Creation date” and “Due date” can be added.
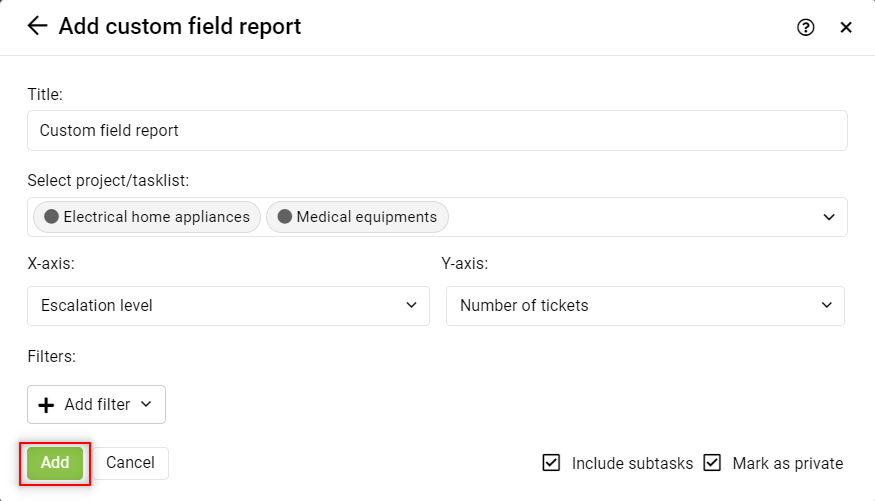
- Select “Add” to see the report.
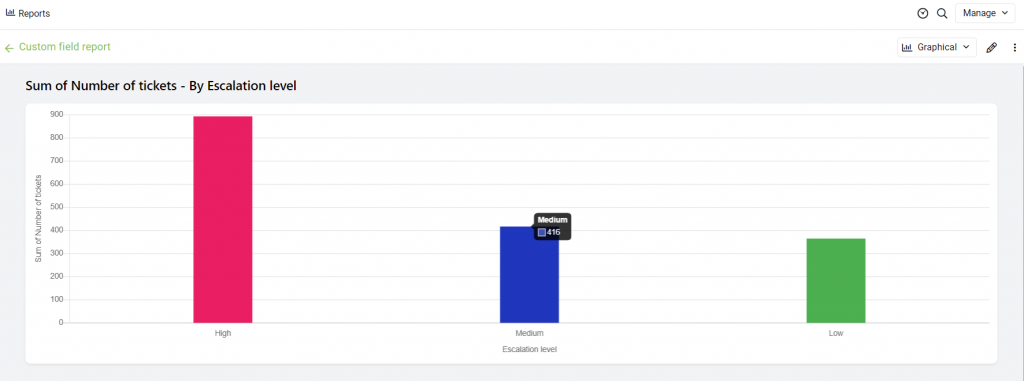
Here’s an example of a created custom field report showing the analysis between “Escalation level” and “Number of tickets”.
Notes:
Custom field reports can be viewed in both graphical and tabular forms.
Custom field reports can be downloaded both in PDF and CSV format.
Need more help?
- Can't find the answer to your questions? Contact ProofHub Support
- Check our blog for the latest additions, updates and tips.