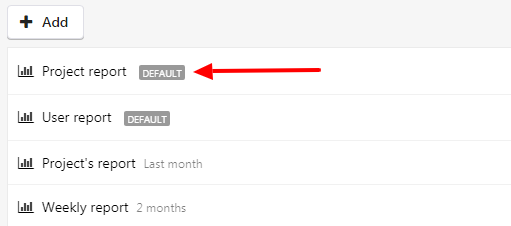
Along with custom reports in ProofHub, one can access default reports as well. There are two types of default reports available. One is for projects and the other one is for a person.
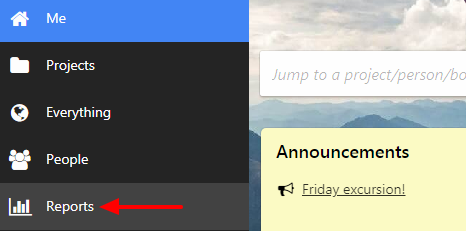
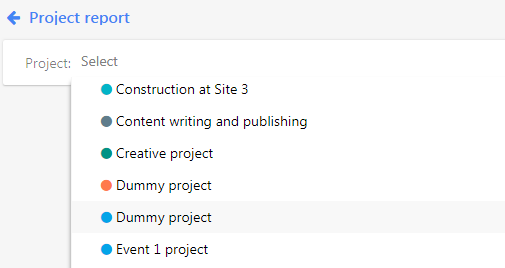
Following are the steps to access a project’s default report:


Note:
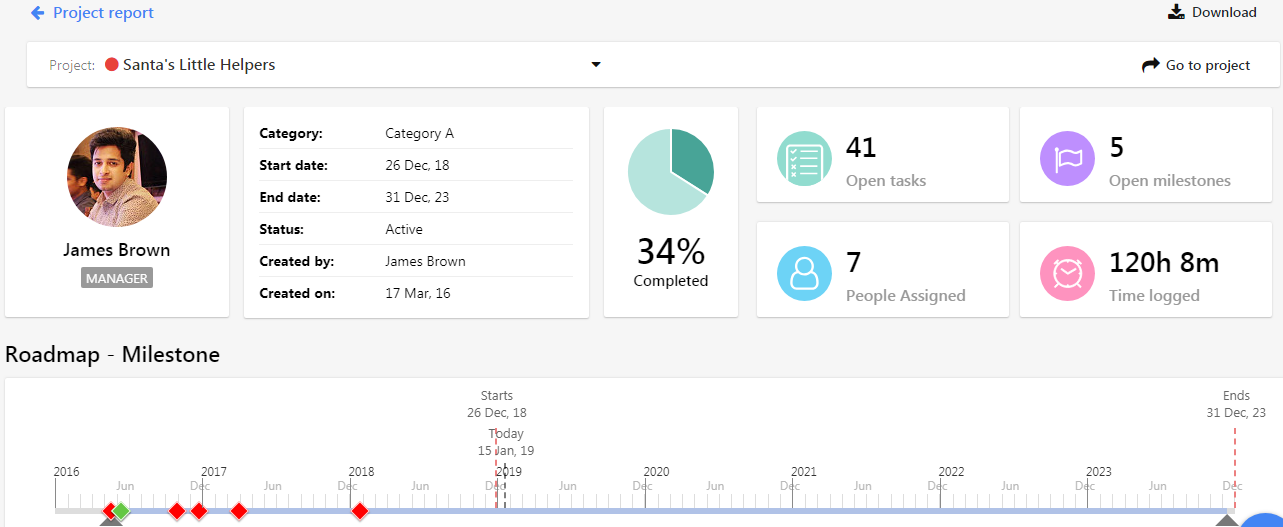
In the default report for the selected project, you’ll see the following information:
Roadmap – Milestones:
You’ll be able to see a timeline for the entire project in which start and end dates will be marked, all milestones will appear on the dates they are due. It will also show you how much the project is completed.

Note
The overdue, upcoming, and completed milestones are denoted with separate colors of red, black, and green respectively.
You can see a table containing the list of all milestones in chronological order.
Burn up chart
You’ll be able to see two line graphs that track completed work/tasks and total work/tasks. It’ll help you to know if the project is not yet completed because work is being done slowly, or if too much work is being added.
 Overdue tasks
A list of all overdue tasks present in the project will show up here. These overdue tasks are shown in tabular form and arranged in chronological order.
Tasks by labels
You can see the count of tasks on which a label is assigned that are overdue, completed, and open. Also, you’ll see the count of total tasks to which the label is assigned.
 Tasks by resource
You’ll be able to see the count of tasks on which a person is assigned that are overdue, completed, and open. Also, you’ll see the count of total tasks to which a person is assigned.
 Task by Workflow
You’ll see a stacked bar graph for each workflow in which you’ll see total tasks, overdue tasks, and completed tasks. For each workflow, you’ll see information in tabular form and the bar chart form. In the tabular form, you’ll be able to see the following information:
 Time logged
Information regarding the time logged in a project can be seen here. Time logged information will be shown in terms of status wherein you’ll be able to see a table showing status name and total time having that status. Also, you’ll be able to see a pie chart regarding it.
Information on time logged according to resources and timesheets wherein the data will appear in the tabular form containing resource name, status name, total time logged.

- Can't find the answer to your questions? Contact ProofHub Support
- Check our blog for the latest additions, updates and tips.